A sheet for each way an ILP goal gets measured.
Free printable ILP data collection sheets
Print them, copy them, hand them to a para. Four of them fill in with your goals first, and a QR code reprints the same sheet next month.
No email address, no account. Printing never asks for anything.
- Fills in your goals
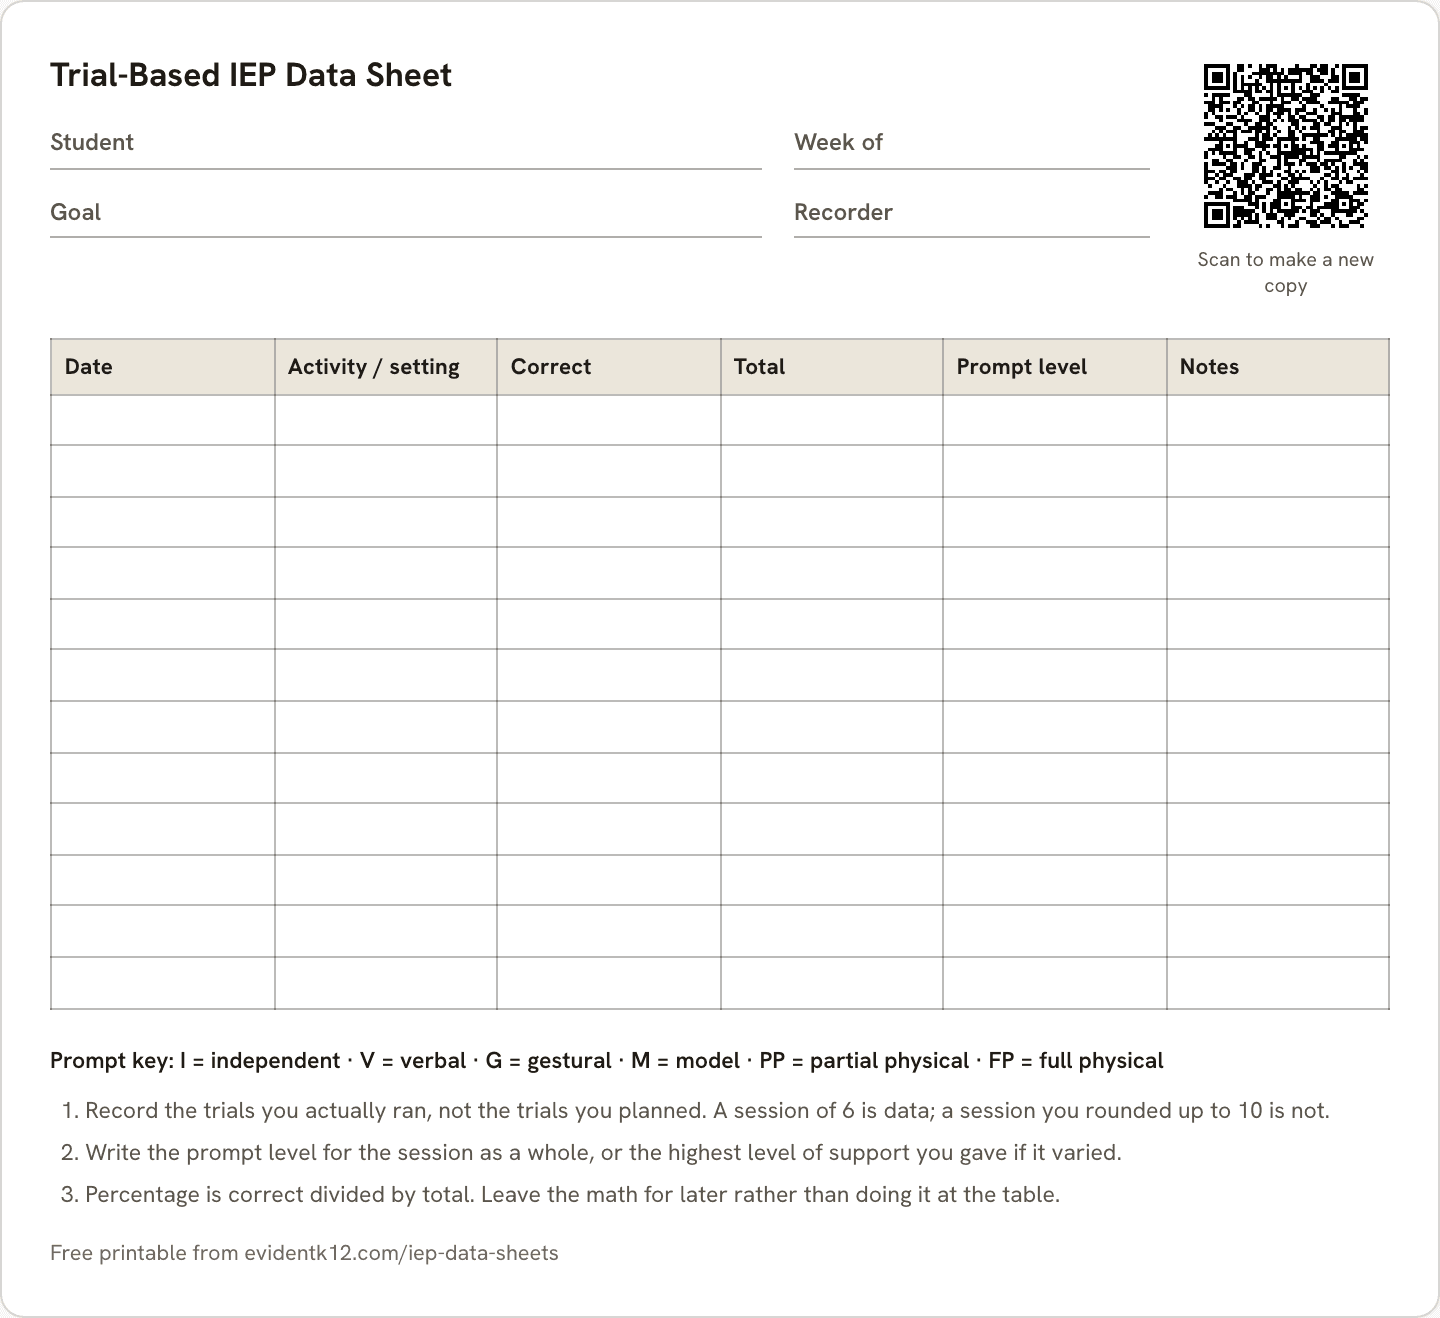
Trial-Based ILP Data Sheet
Goals measured as correct trials out of a total.
- Fills in your goals
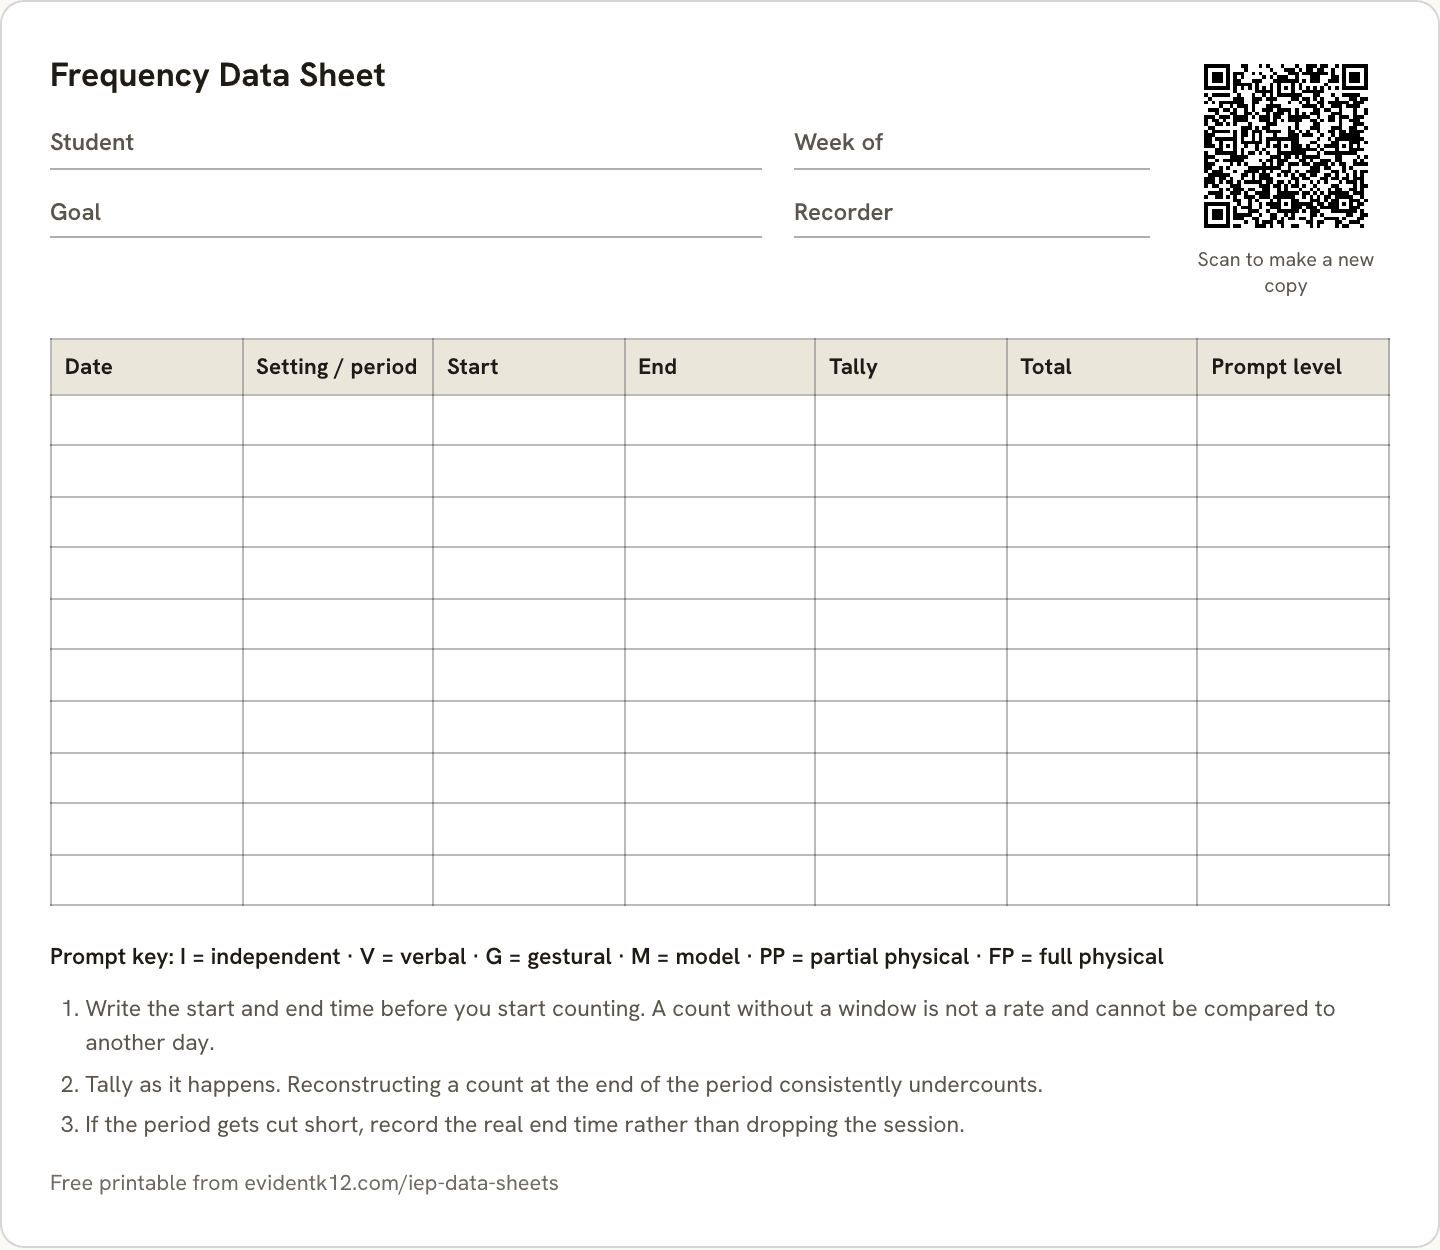
Frequency Data Sheet
Goals measured as a count of occurrences.
- Fills in your goals
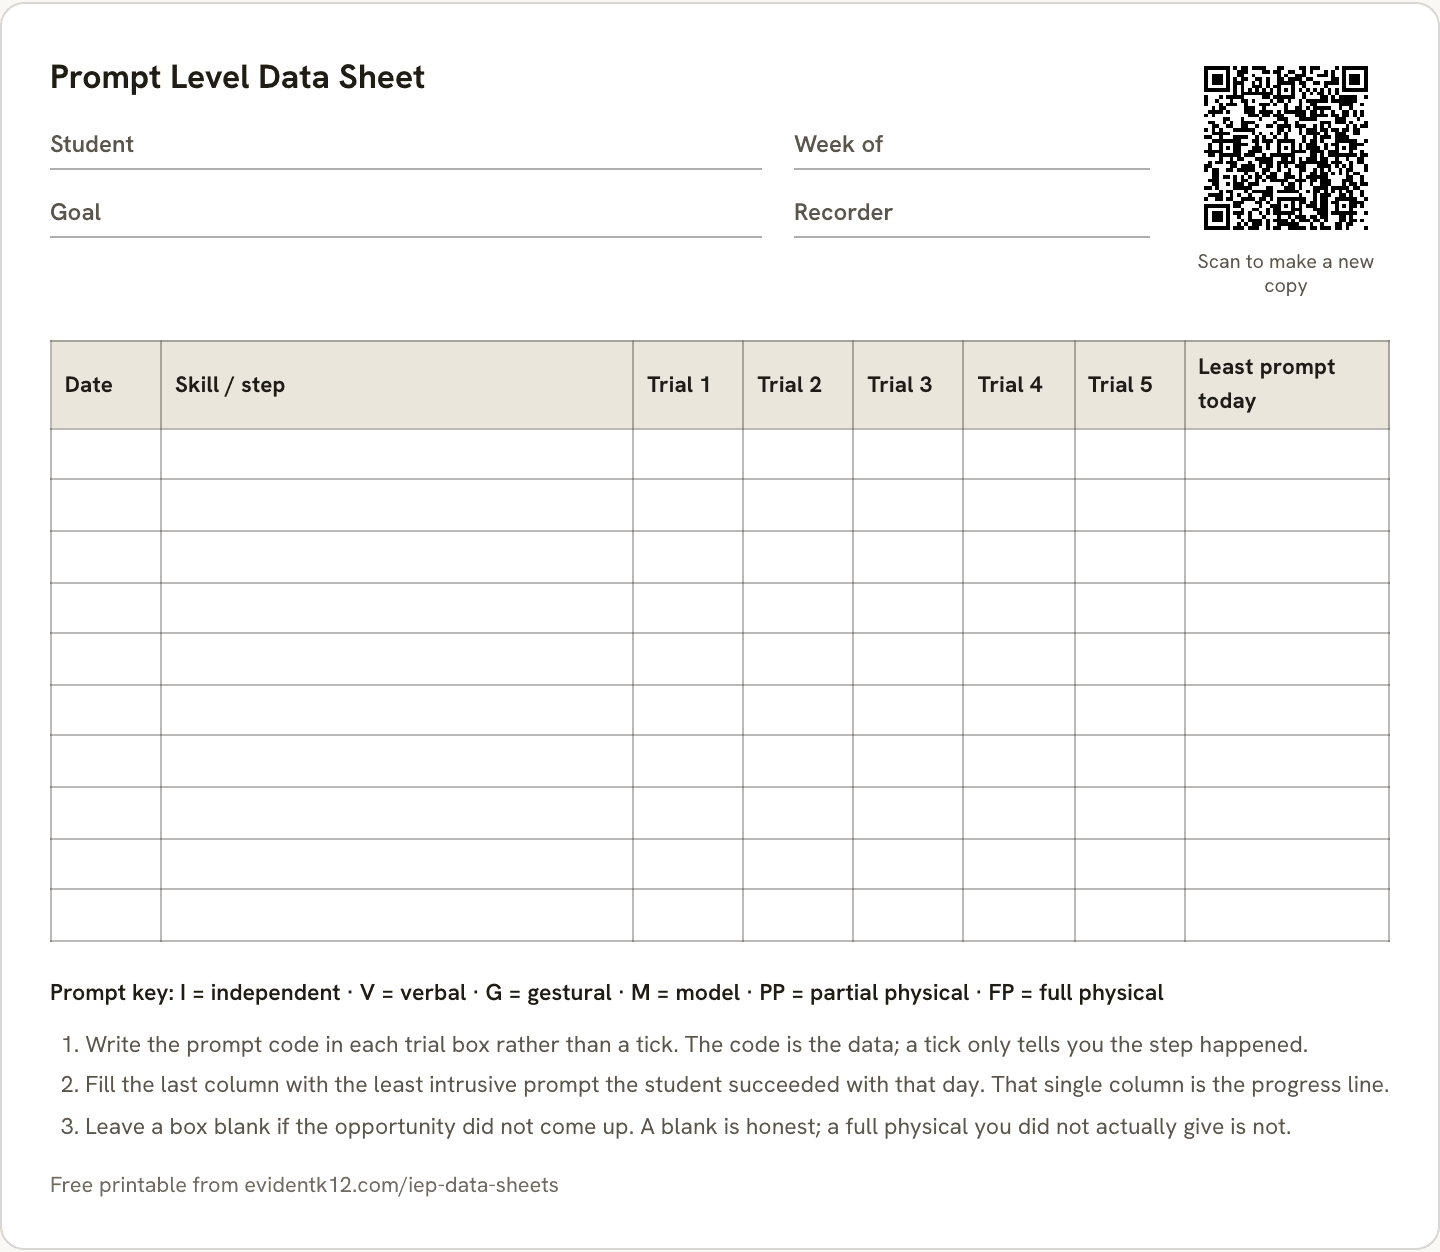
Prompt Level Data Sheet
Goals where the question is how much help, not how many correct.
Not sure which sheet a goal calls for? Choosing a measurement type matches the verb in the goal to the sheet that fits, and the progress monitoring guide explains each method.
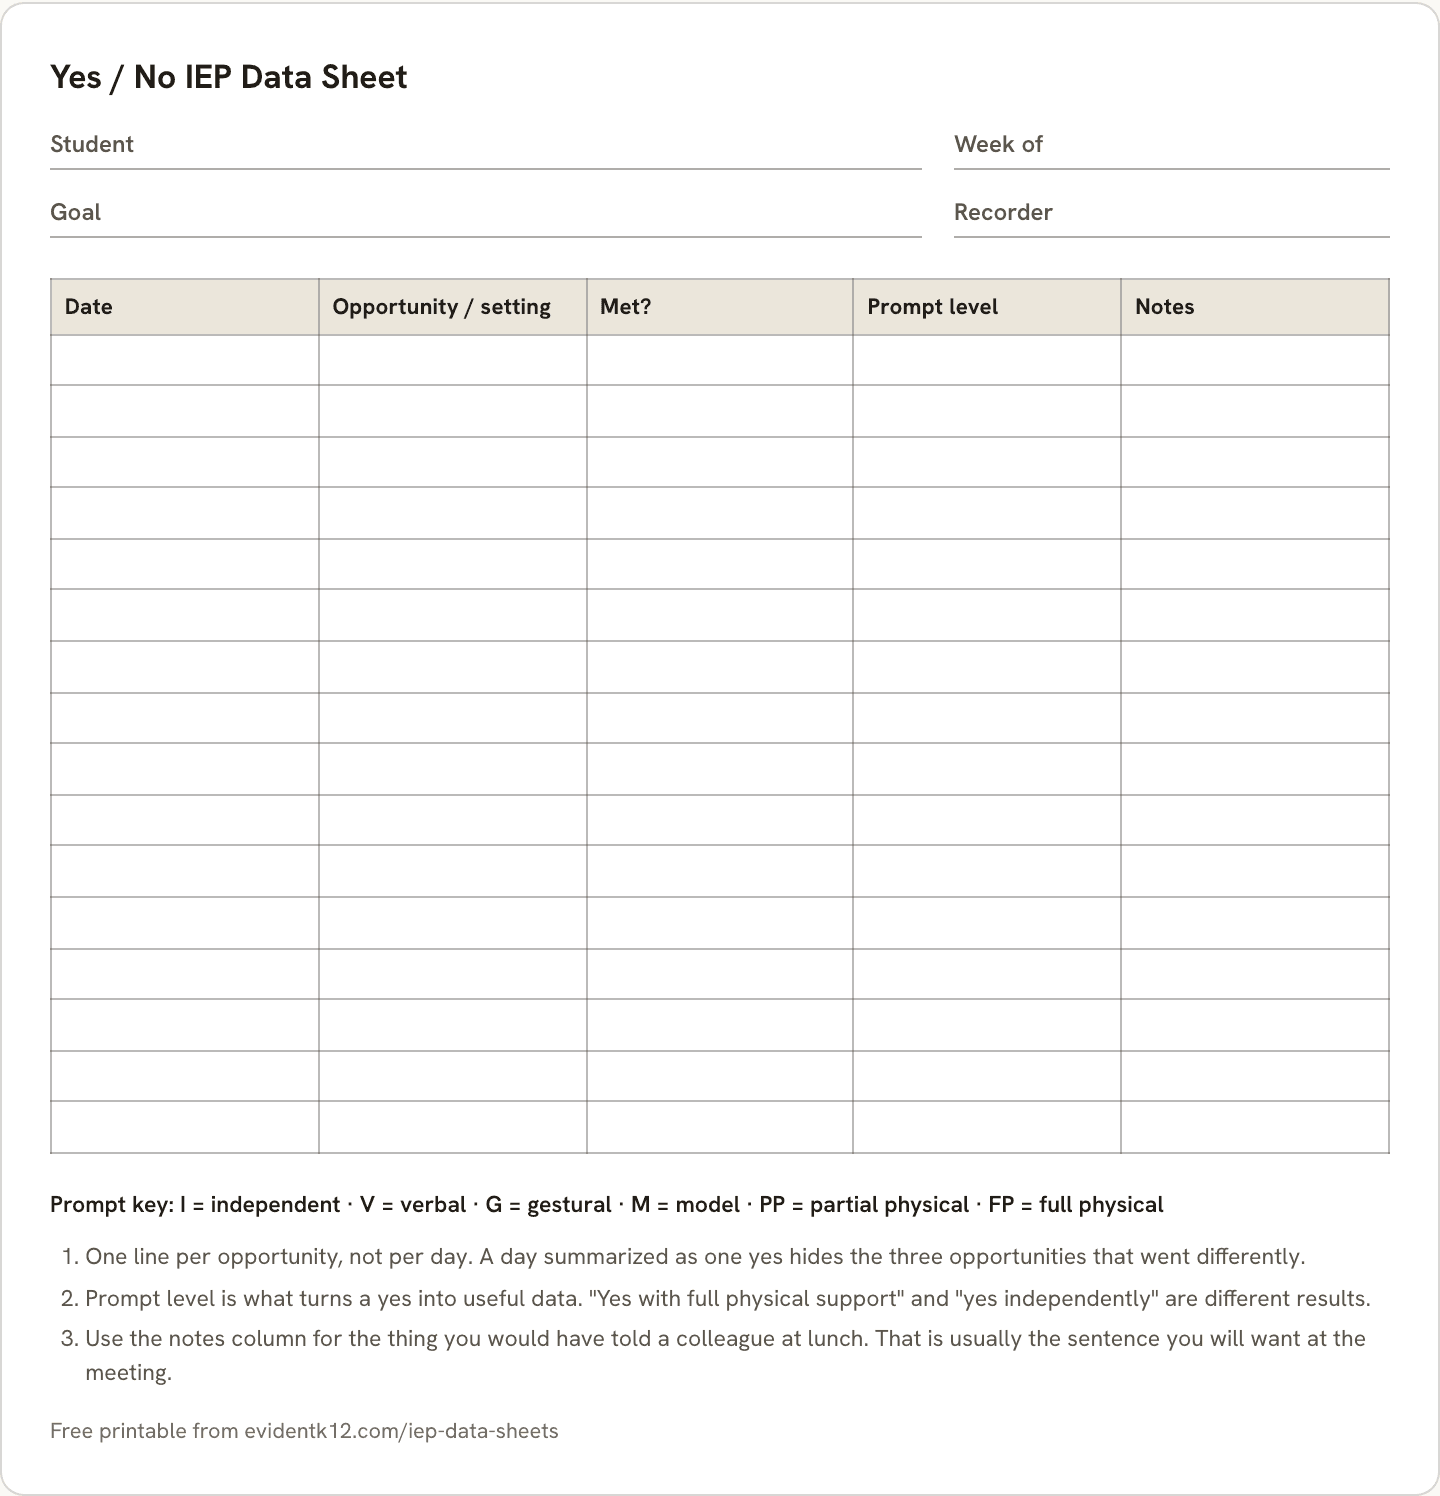
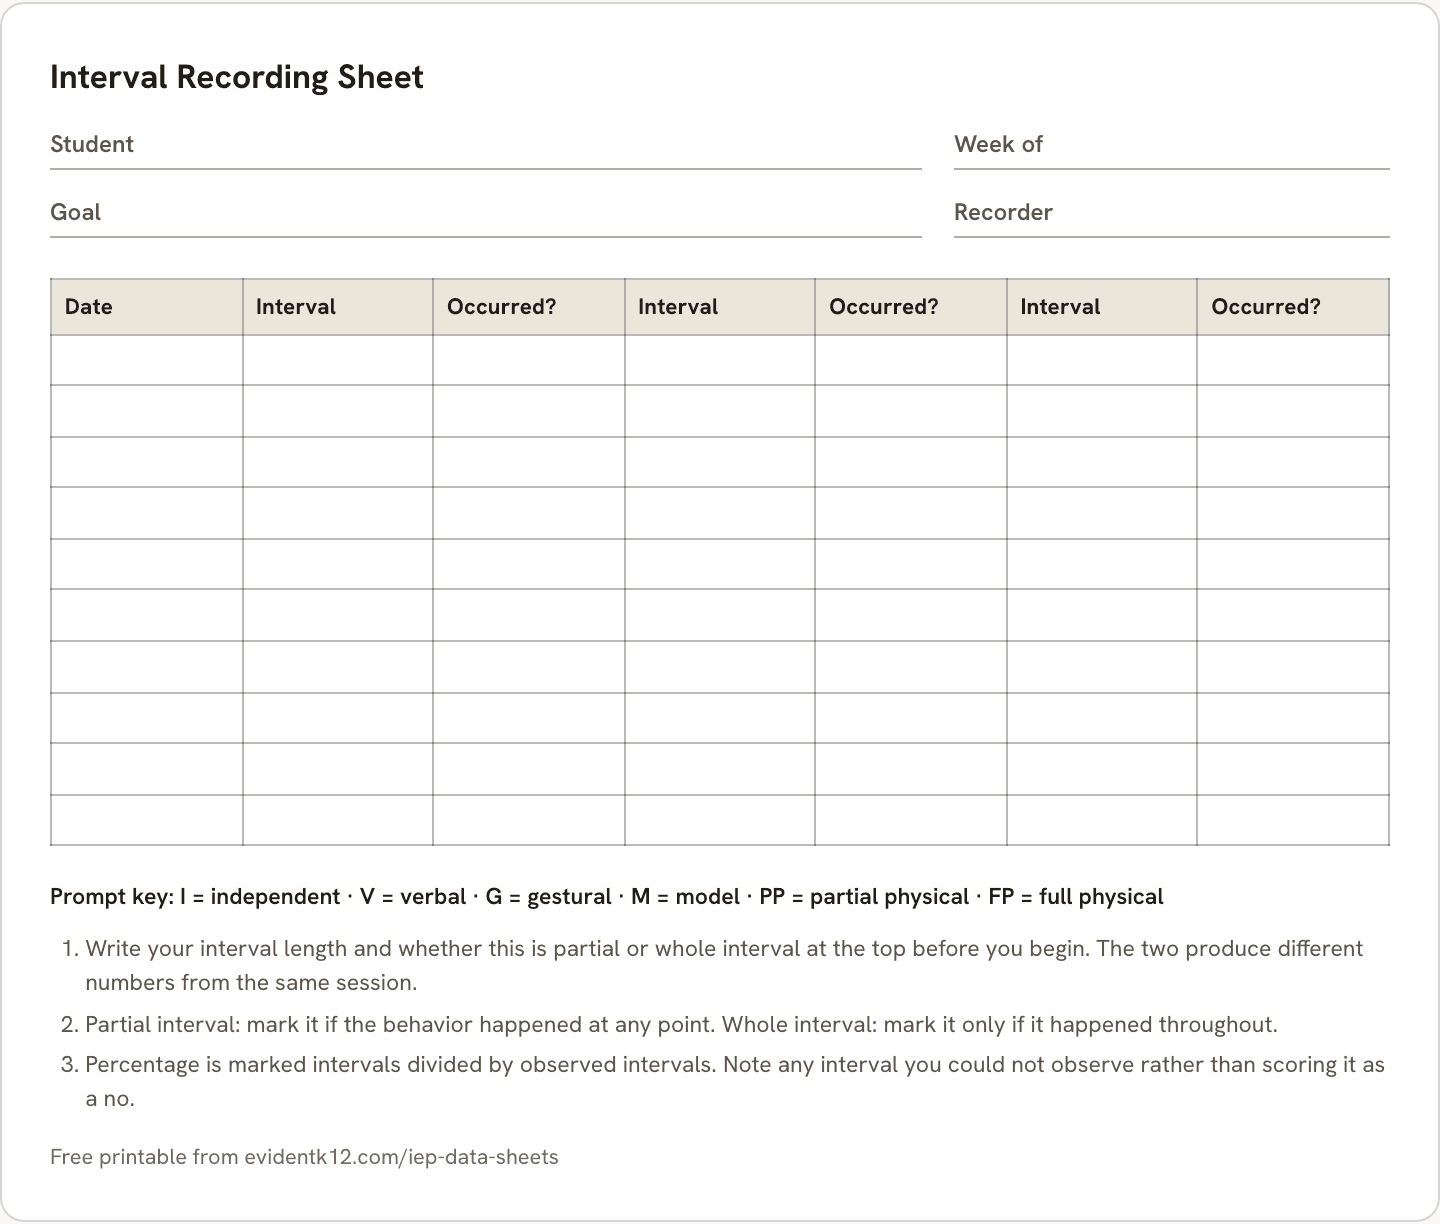
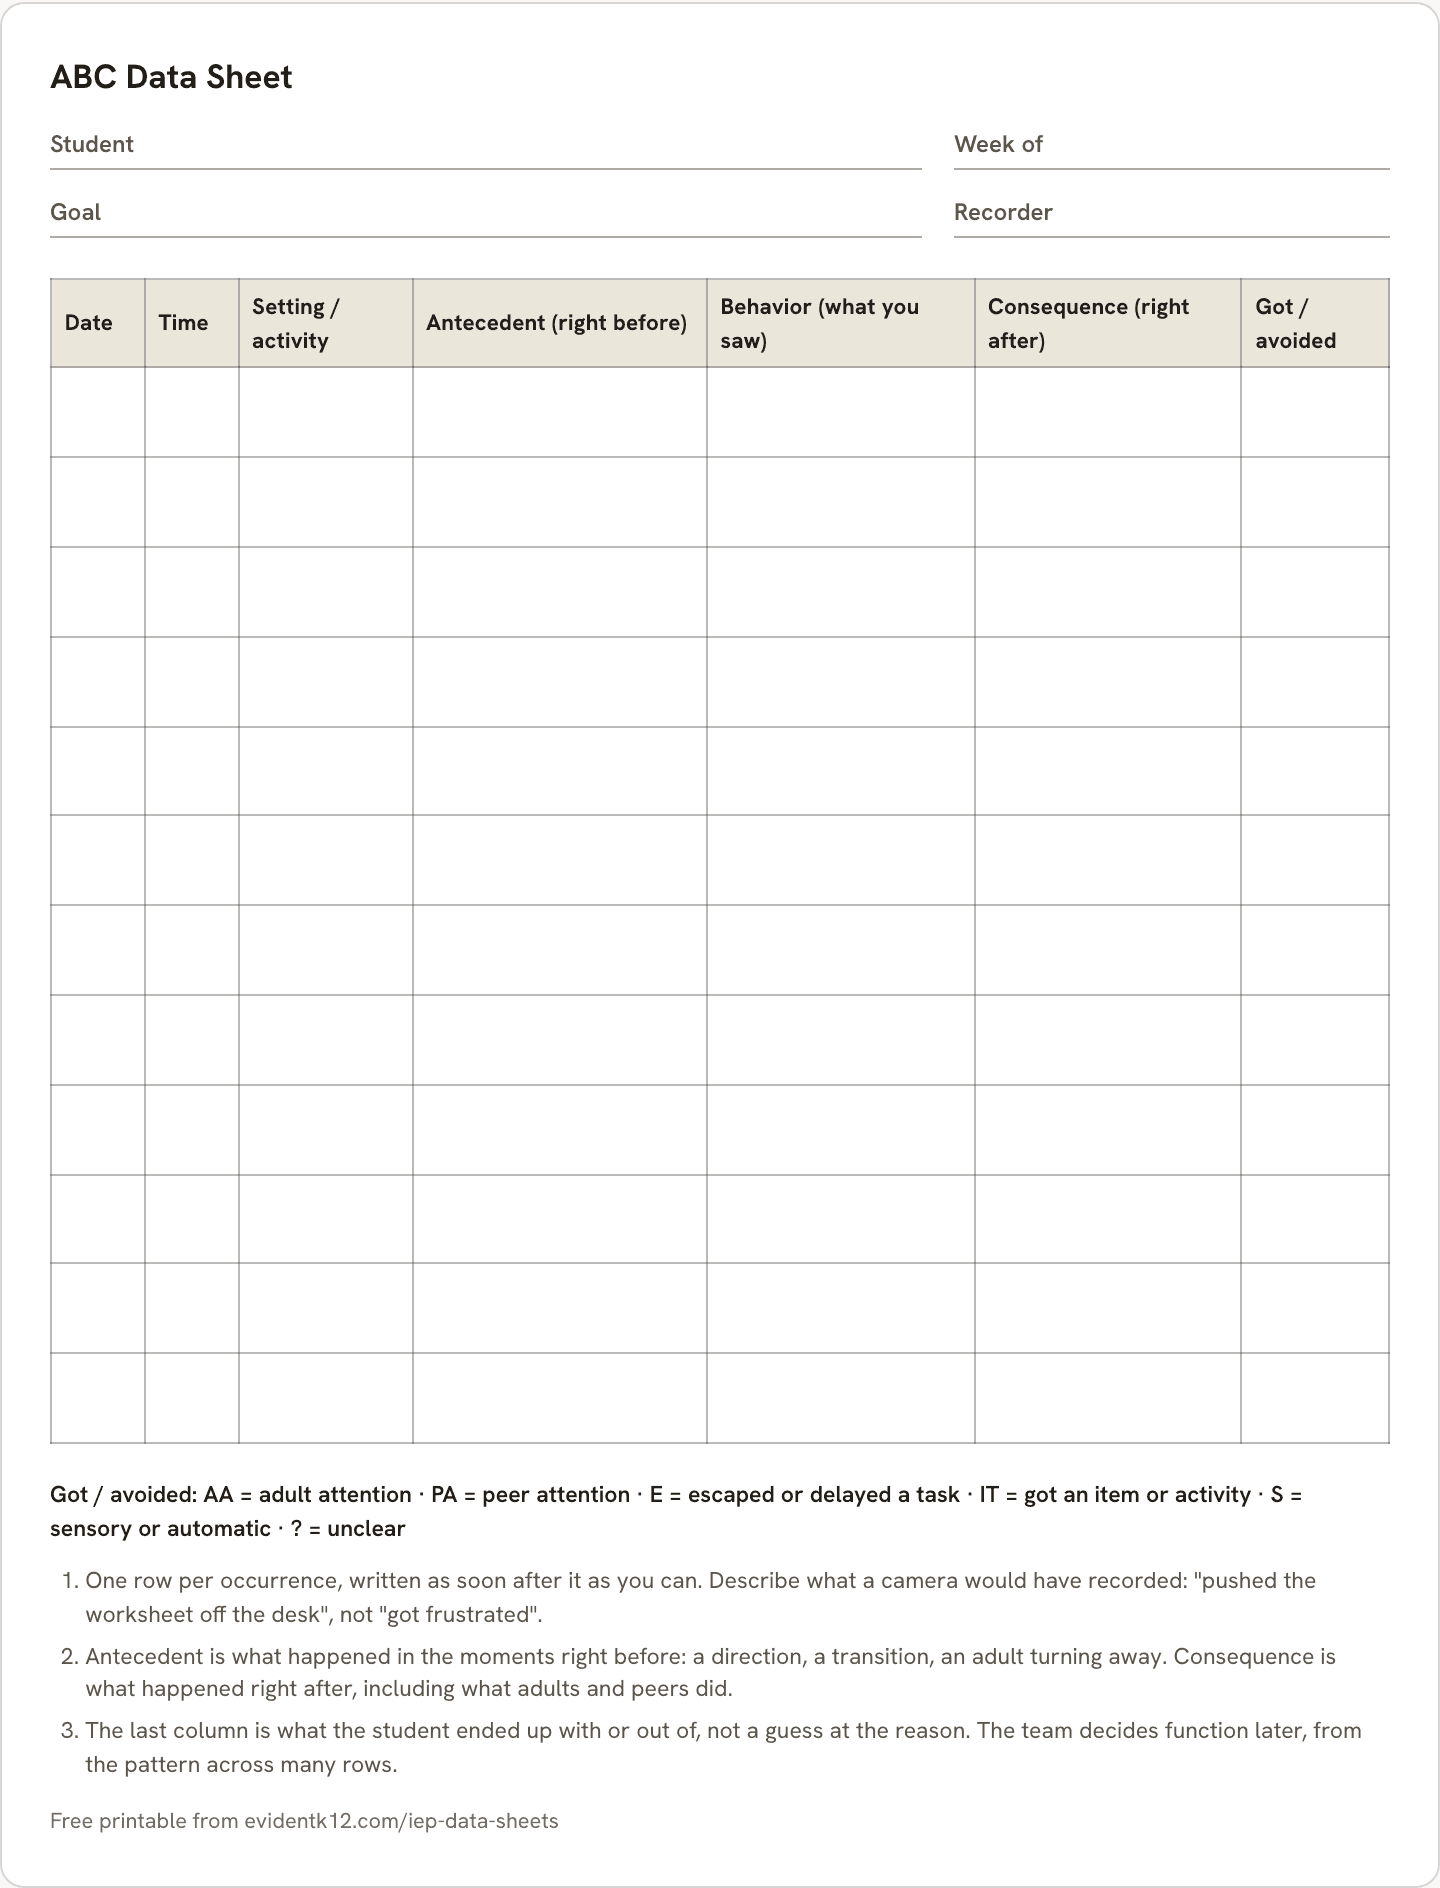
Four habits that make a sheet hold up
A stack of sheets becomes a progress report in the spring only if each one says what it was.
- Write the goal at the top.
Fill it in before you copy the stack. A sheet that names its goal survives the filing cabinet.
- Record the session you ran.
If you ran six trials, record six. Keep the total and the prompt level with the result.
- Write the prompt level every time.
Even when it is independent. “Independent” helps the team distinguish the skill from the support provided.
- Date every row.
A date lets the team place the result in the reporting period and compare it with other sessions.
From the clipboard to the graph
The same data point, on paper or on a phone, saved to the student and graphed.
Mark the sheet, or tap it in.
A para marks the sheet at the table, or taps each opportunity on a phone. Record a dated result and prompt level online to add it to the goal graph. Printed marks need to be entered; the sheet does not sync automatically.
01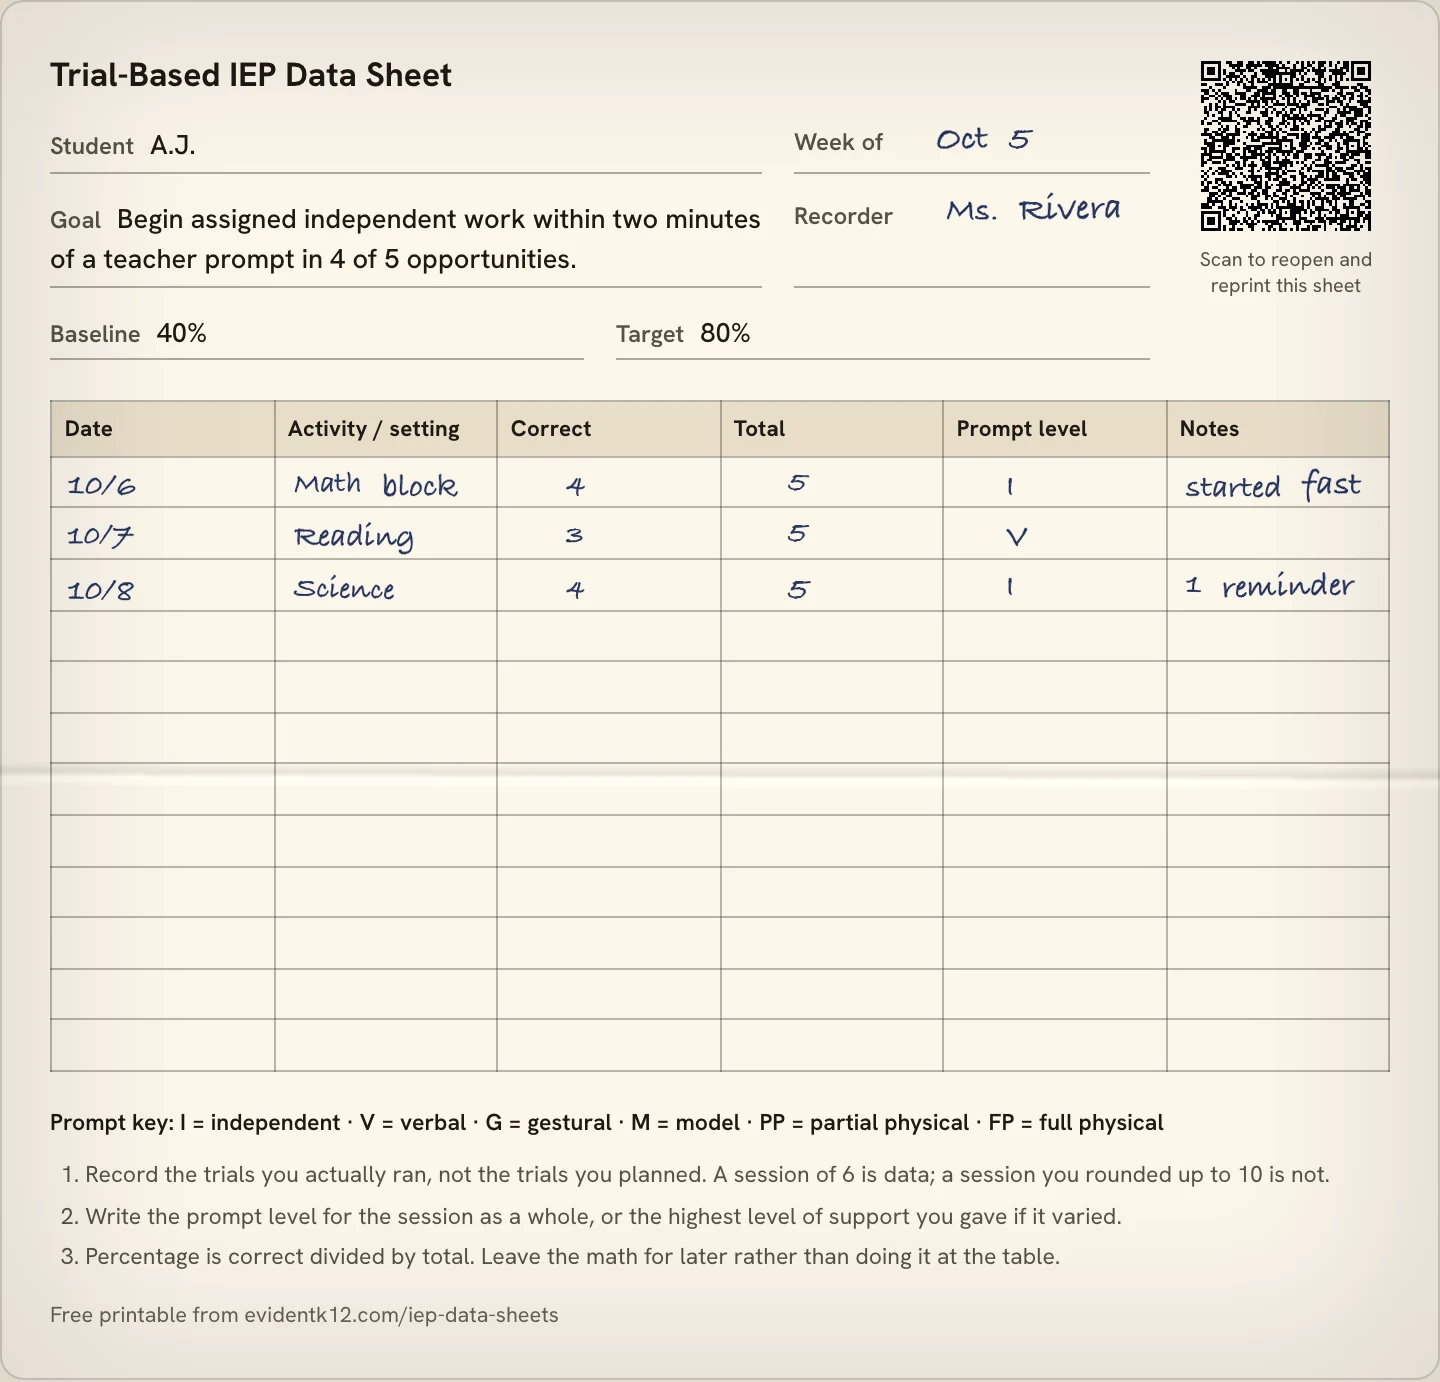
A stack of sheets can't graph itself. Or on a phone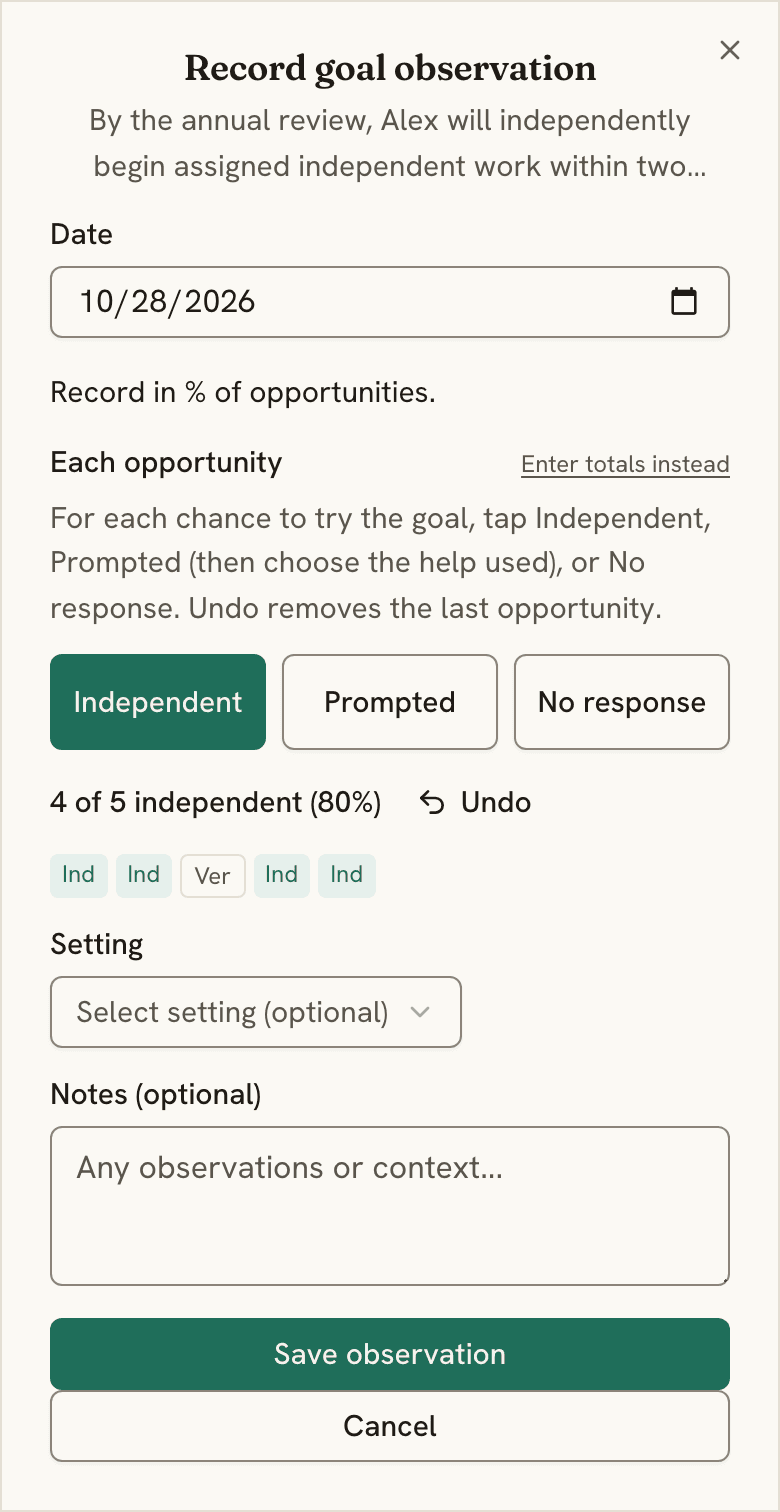
The graph draws itself.
Baseline, target, and the mastery line, across the school year. No typing a stack of sheets into a spreadsheet in May.
02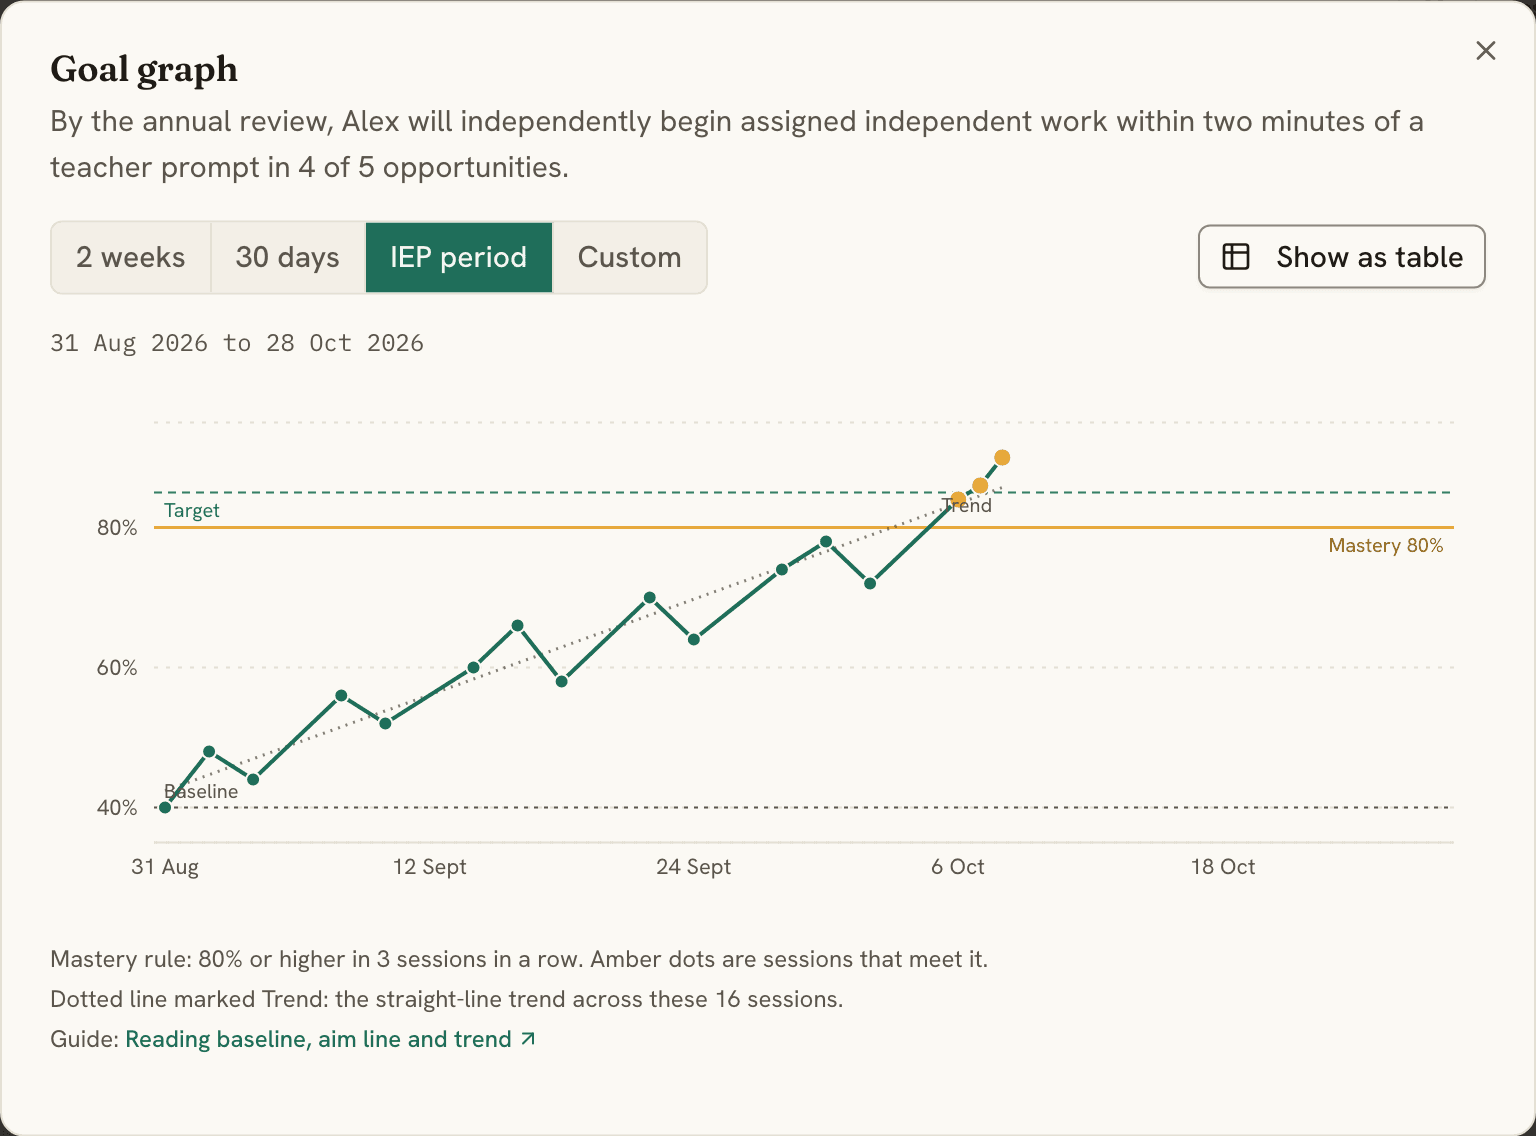
Mastery gets flagged. The report is ready.
When a goal meets its mastery rule, the case manager sees it. The ILP progress report is built from the sessions you recorded. Review the report against the recorded sessions before sharing.
03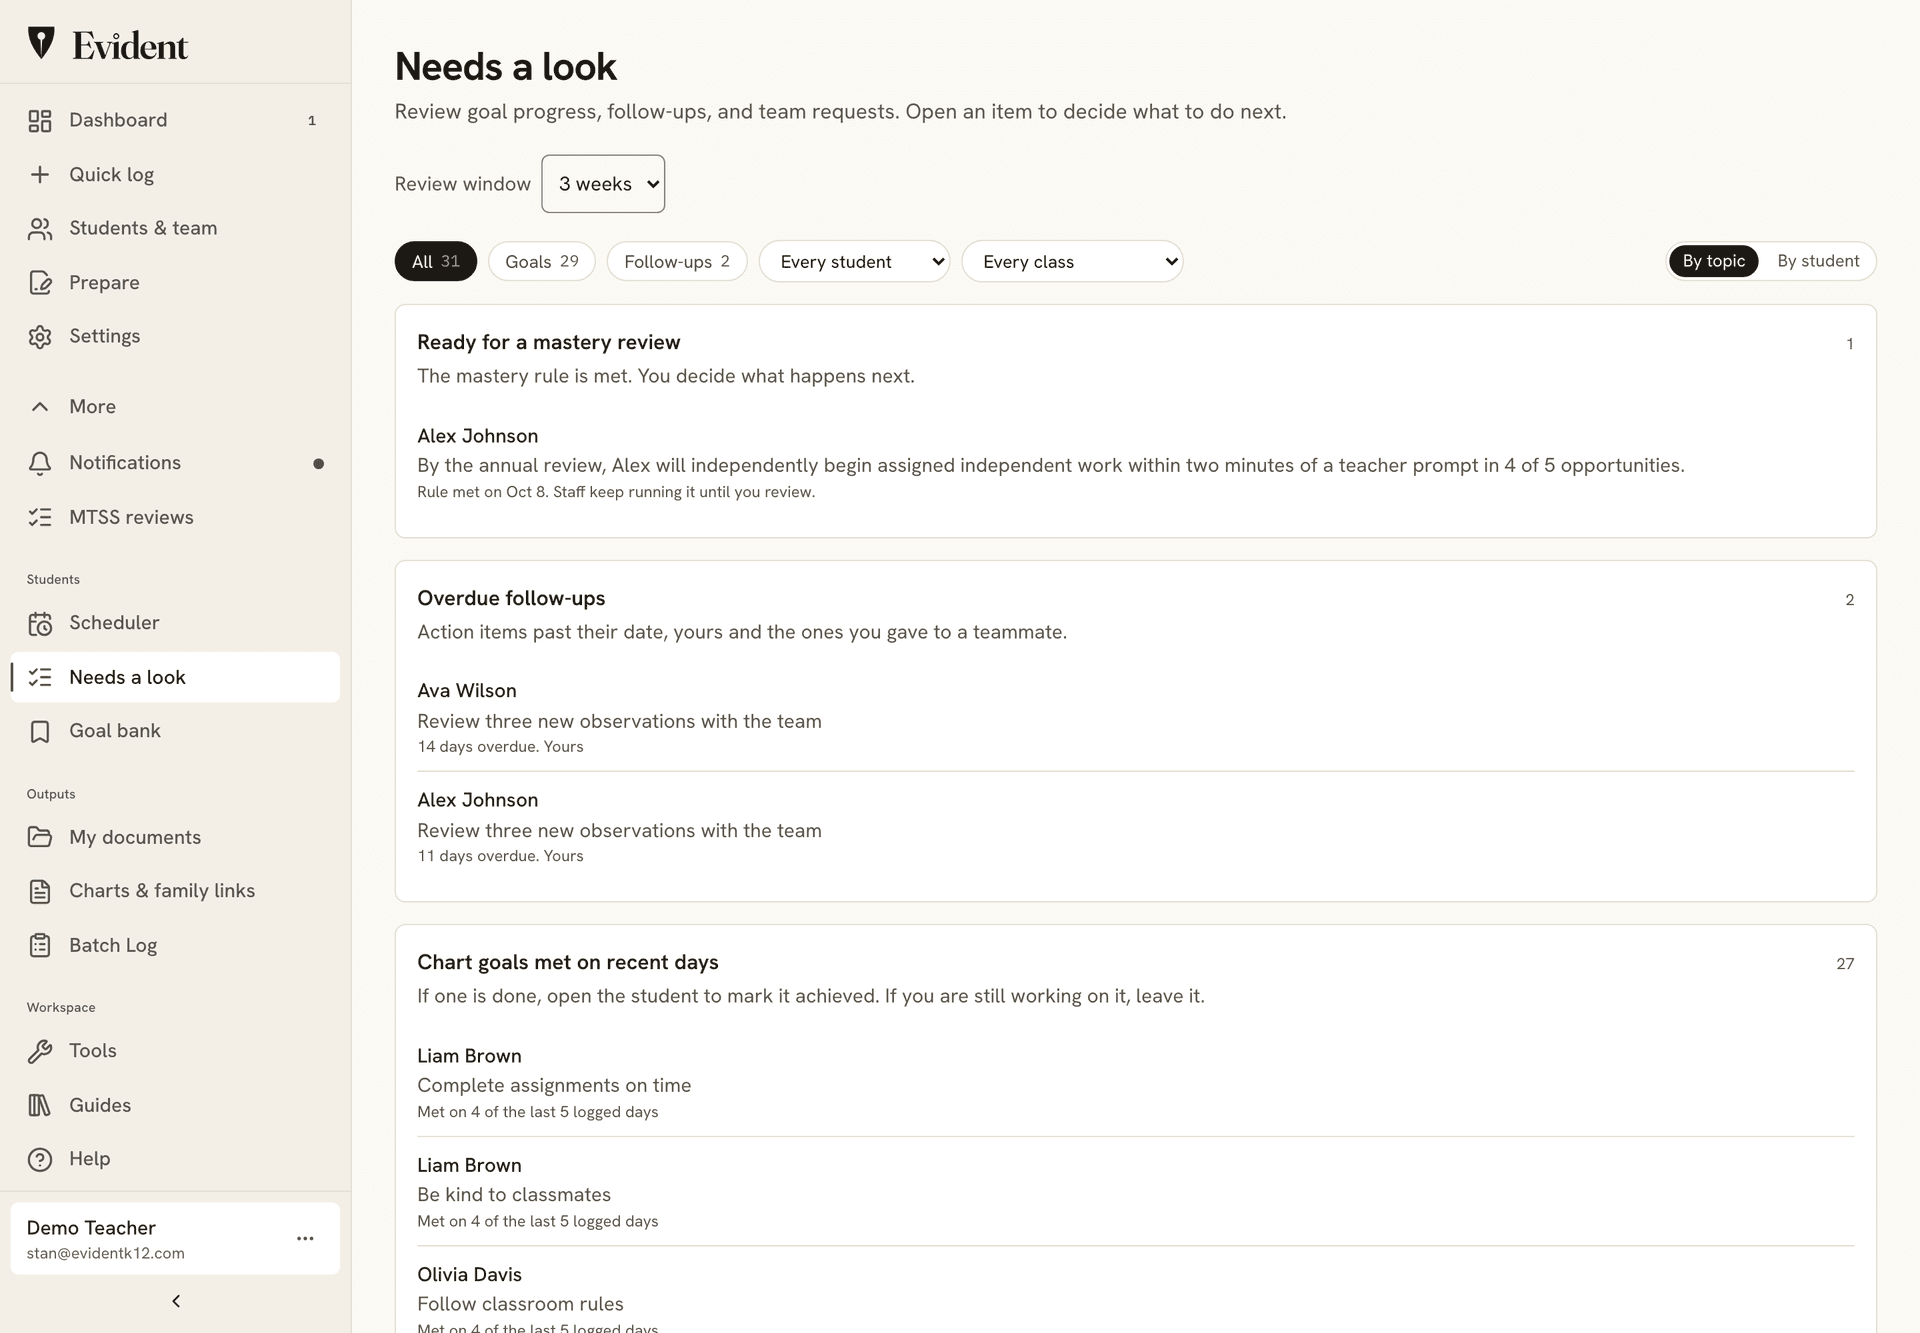

Keep the sheets.
Add the graph.
Track ILP goals free for up to 30 students. Your first PDF report is free; Pro or a school plan adds ongoing exports.
Printing a sheet never asks for an email. Student data stays private: how we protect it.